The following figure shows the cost curves (ATC,average total cost; MC,marginal cost) of firm that operates in a monopolistic competition market,as well as the demand (D) facing the firm and its marginal revenue (MR) .How much profit does this firm make in the short run?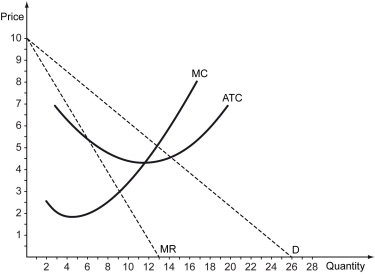
A) $10
B) $18
C) $27
D) $0
Correct Answer:
Verified
Q140: A monopolistically competitive firm shuts down in
Q141: Scenario: The fixed cost of producing 500
Q142: The following figure shows the cost curves
Q143: The following figure shows the cost curves
Q144: Scenario: The fixed cost of producing 500
Q146: A monopolistic competitor exits the industry in
Q147: Scenario: The fixed cost of producing 500
Q148: The figure below depicts a monopolistically competitive
Q149: Scenario: There are several pen manufacturers in
Q150: The following figure shows the cost curves
Unlock this Answer For Free Now!
View this answer and more for free by performing one of the following actions

Scan the QR code to install the App and get 2 free unlocks

Unlock quizzes for free by uploading documents