Multiple Choice

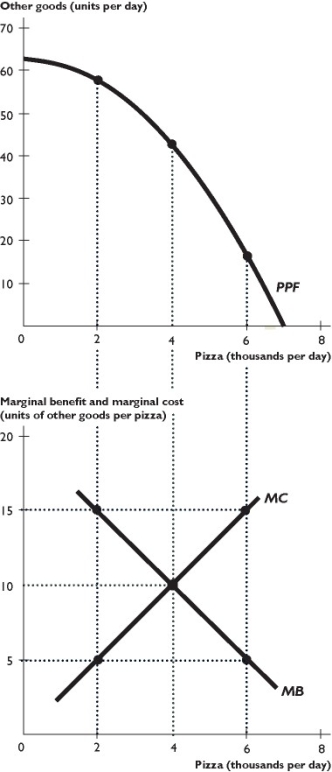
-The figure above shows the PPF,marginal cost curve,and marginal benefit curve for pizza.
In the figure above,when 2,000 pizzas are produced,the marginal benefit of a pizza ________ its marginal cost,which means ________ pizza is being produced.
A) exceeds its marginal cost; too little
B) exceeds its marginal cost; too much
C) is below its marginal cost; too much
D) is below its marginal cost; too little
E) equals its marginal cost; the efficient quantity of
Correct Answer:
Verified
Related Questions

