Multiple Choice
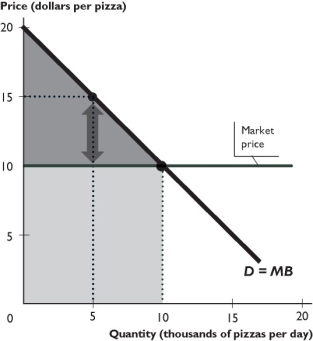
The figure above shows the demand curve for pizza and the market price of pizza.
-In the figure above,how much is the consumer who buys the 5,000th pizza willing to pay for that pizza?
A) $15
B) $10
C) $12
D) $22.50
E) $5
Correct Answer:
Verified
Related Questions

