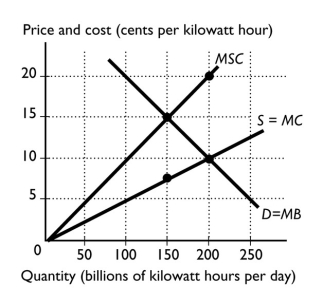
-The figure above shows the marginal social cost curve of generating electricity,the marginal private cost curve,and the demand curve.If the market is competitive and unregulated,the equilibrium price is ________ per kilowatt hour and the equilibrium quantity is ________ billions of kilowatt hours per day.
A) 10¢; 200
B) 15¢; 150
C) 20¢; 200
D) 20¢; 100
E) 7.5¢; 150
Correct Answer:
Verified
Q102: Q103: A problem with pollution charges or taxes Q107: Q108: Which of the following best describes an Q109: Which of the following is an example Q111: The cost of producing an additional unit Q113: Firm A and Firm B emit 300 Q115: Cap-and-trade refers to Q116: Q118: Unlock this Answer For Free Now! View this answer and more for free by performing one of the following actions Scan the QR code to install the App and get 2 free unlocks Unlock quizzes for free by uploading documents![]()
![]()
A) capping emissions and issuing![]()
![]()

