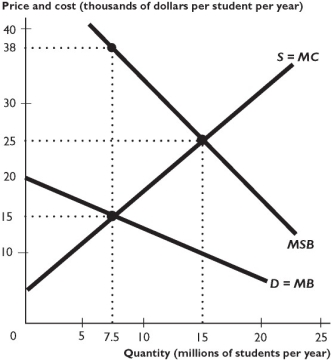
The figure above shows the demand for college education (D) , the marginal social benefit of college education (MSB) , and the marginal cost of the private schools (MC) .
-Based on the figure above,when the market is unregulated and is in equilibrium,the deadweight loss is
A) $86.25 million per year.
B) $56.25 million per year.
C) $48.75 million per year.
D) $37.50 million per year.
E) zero.
Correct Answer:
Verified
Q245: Q246: In a market with an external cost,government Q247: A competitive,unregulated market would Q248: An externality can be a cost or Q249: When people decide whether or not to Unlock this Answer For Free Now! View this answer and more for free by performing one of the following actions Scan the QR code to install the App and get 2 free unlocks Unlock quizzes for free by uploading documents![]()
A) produce too much

