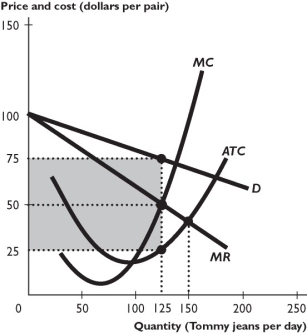
The figure above illustrates a firm's demand and marginal revenue curves and its cost curves.
-If the firm in the figure above attempted to minimize its average total cost by producing 100 pairs of Tommy jeans per day at an average total cost of $20 per pair and it sold those jeans for $80 per pair,the firm would ________.
A) make zero economic profit
B) make a larger economic profit that a firm that produced 125 jeans because the ATC of producing 125 jeans is higher than the ATC of producing 100 jeans
C) incur an economic loss
D) make a smaller economic profit than a firm that produced 125 jeans
E) achieve an efficient use of resources
Correct Answer:
Verified
Q129: Once a firm in monopolistic competition has
Q133: One of the major benefits to society
Q137: Which of the following is an advantage
Q141: A firm in monopolistic competition that introduces
Q141: To maintain their economic profits,firms in monopolistic
Q146: Which of the following statements about product
Q147: For a firm in monopolistic competition,selling costs
A)
Q153: In the long run,advertising by all firms
Q158: In the example of the Nike running
Q165: One reason a company advertises is to
A)
Unlock this Answer For Free Now!
View this answer and more for free by performing one of the following actions

Scan the QR code to install the App and get 2 free unlocks

Unlock quizzes for free by uploading documents