Multiple Choice
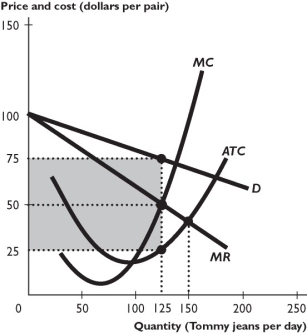
The figure above illustrates a firm's demand and marginal revenue curves and its cost curves.
-When the firm in the figure above maximizes its profit,it makes an economic profit of
A) $3,125.
B) $6,250.
C) $9,375.
D) $5,625.
E) None of the above answers are correct because the firm incurs an economic loss.
Correct Answer:
Verified
Related Questions
Q173: Q174: The clothing industry has many firms with Q175: If all firms in the industry have Q180: Firms in monopolistic competition![]()
A) face a downward-sloping

