The graph to the right, where YO2 represents %O2 saturation, will be used for the following questions 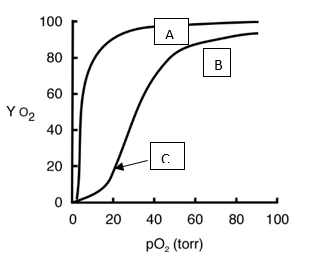
-The plot above describes the Bohr effect. If a third plot were added, a sigmoidal one between plots A and B,
A) this third plot would suggest an increased affinity of oxygen for hemoglobin
B) it would represent adult hemoglobin, and plot B would represent fetal hemoglobin
C) it would likely be seen if hemoglobin were in a more acidic environment
D) it would represent fetal myoglobin, and plot A would represent adult myoglobin
E) it would represent fetal hemoglobin retained in the T state
Correct Answer:
Verified
Q17: With respect to oxygen saturation, hemoglobin is
Q18: While the composition of hemoglobin in
Q19: The graph to the right, where YO2
Q20: The graph to the right, where YO2
Q21: The graph to the right, where YO2
Q23: The structure of the globin protein plays
Q24: At active muscle
I. pCO2 is high
II. acidity
Q25: At high pCO2, the oxygen binding curve
Q26: The absence of 2,3-bPG causes hemoglobin's affinity
Q27: Which allosteric effector has the greatest ability
Unlock this Answer For Free Now!
View this answer and more for free by performing one of the following actions

Scan the QR code to install the App and get 2 free unlocks

Unlock quizzes for free by uploading documents