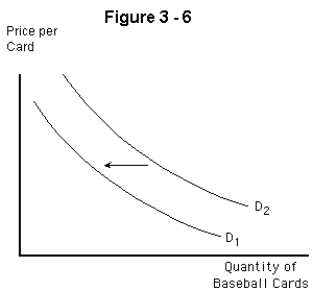
-Assuming that baseball and football cards are substitutes.What might explain the shift in demand curve for baseball cards from D₂ to D₁ in Figure 3-6?
A) an increase in the price of baseball cards
B) a decrease in the price of baseball cards
C) an increase in income (assuming that baseball cards are a normal good)
D) an increase in the population
E) a decrease in the price of football cards
Correct Answer:
Verified
Q55: Betsy graduates from college,where she earned $3,000
Q56: If the price of ground beef falls,the
Q57: Which of the following would shift the
Q58: Which of the following is assumed constant
Q59: Income is to wealth as
A) hours are
Q61: Of the following,which is most likely to
Q62: If an increase in a person's income
Q63: Which of the following would not lead
Q64: If some piece of information causes buyers
Q65: Figure 3-7
![]()
Unlock this Answer For Free Now!
View this answer and more for free by performing one of the following actions

Scan the QR code to install the App and get 2 free unlocks

Unlock quizzes for free by uploading documents