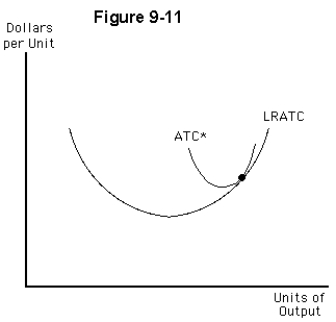
-Figure 9-11 illustrates the long-run average total cost curve for a perfectly competitive firm and the short-run average total cost curve (ATC*) for the firm's current plant size.In the long run,this
A) firm's plant size is too large to allow it to earn a normal profit
B) firm's plant size is too small to allow it to earn a normal profit
C) firm will be able to stay in operation with the same plant size
D) firm will suffer an economic loss
E) firm will earn an economic profit
Correct Answer:
Verified
Q171: The key assumption that distinguishes a constant
Q172: Which of the following statements about perfectly
Q173: In the long run,each perfectly competitive firm
Q174: When the average total cost curves for
Q175: In a long-run perfectly competitive equilibrium,
A)the typical
Q177: In a perfectly competitive,decreasing-cost industry,the long-run market
Q178: In the long run in a competitive
Q179: If price exceeds average total cost in
Q180: Assume that a constant-cost,perfectly competitive market is
Q181: If expansion of an industry's output causes
Unlock this Answer For Free Now!
View this answer and more for free by performing one of the following actions

Scan the QR code to install the App and get 2 free unlocks

Unlock quizzes for free by uploading documents