Multiple Choice
Figure 2-9
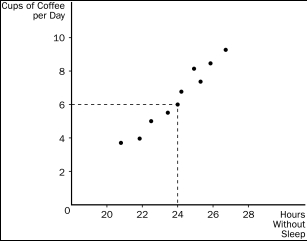
-Refer to Figure 2-9.The graph shown is known as a
A) time series.
B) bar graph.
C) scatterplot.
D) pie chart.
Correct Answer:
Verified
Related Questions
Q5: John Maynard Keynes referred to economics as
Q44: A relatively steep demand curve indicates that
A)quantity
Q47: The slope of a fairly flat upward-sloping
Q209: Since natural experiments offered by history cannot

