Figure 4-6
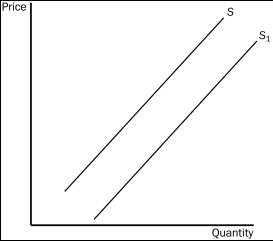
-Refer to Figure 4-6.Suppose the supply curves that are drawn represent supply curves for single-family residential houses.Then the movement from S to S₁ could be caused by
A) an increase in the price of apartments (a substitute for single-family houses for many people looking for a place to live) .
B) a newly-formed expectation by house-builders that prices of houses will increase significantly in the next six months.
C) a decrease in the price of lumber.
D) All of the above are correct.
Correct Answer:
Verified
Q159: Figure 4-5 Q160: If car manufacturers begin utilizing new labor-saving Q161: Figure 4-7 Q162: A decrease in input costs to firms Unlock this Answer For Free Now! View this answer and more for free by performing one of the following actions Scan the QR code to install the App and get 2 free unlocks Unlock quizzes for free by uploading documents
![]()
![]()

