Multiple Choice
Figure 4-10
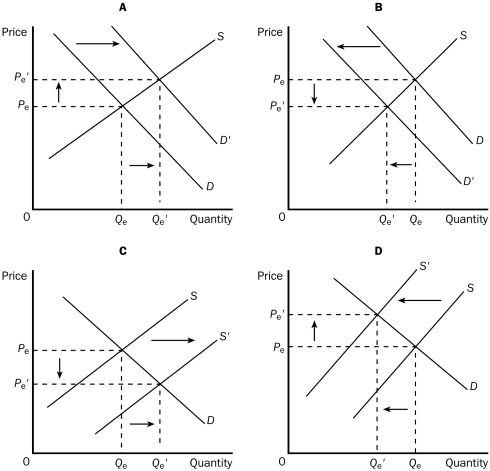
-Refer to Figure 4-10.Graph A shows which of the following?
A) an increase in demand and an increase in quantity supplied
B) an increase in demand and an increase in supply
C) an increase in quantity demanded and an increase in quantity supplied
D) an increase in supply and an increase in quantity demanded
Correct Answer:
Verified
Related Questions
Q115: Holding all other things constant,a higher price

