Multiple Choice
Figure 4-10
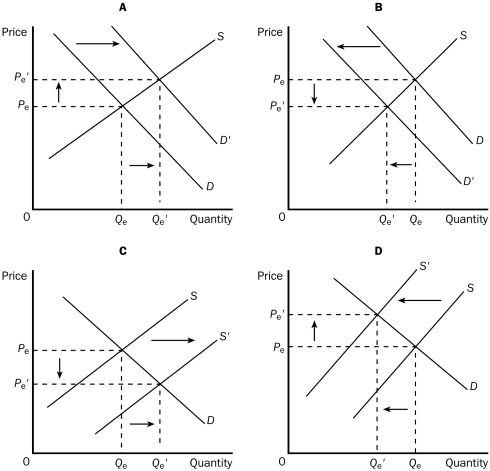
-Refer to Figure 4-10.Which of the four graphs illustrates an increase in quantity supplied?
A) a.
B) B.
C) C.
D) D.
Correct Answer:
Verified
Related Questions
Q157: If goods A and B are complements,then
Q211: If the demand for a product increases,we

