Figure 6-11. On the graph below, the shift of the supply curve from S₁ to S₂ represents the imposition of a tax on a good. On the axes, Q represents the quantity of the good and P represents the price.
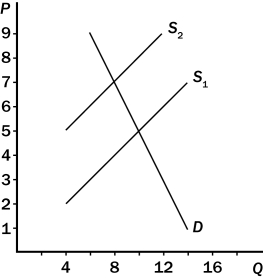
-Consider Figure 6-11.As a result of the tax,
A) the price paid by buyers rises from $5 to $7.
B) the price received by sellers (after paying the tax) falls from $5 to $3.
C) the government collects $30 in tax revenue.
D) All of the above are correct.
Correct Answer:
Verified
Q160: Figure 6-10 Q163: A key lesson from the payroll tax Q164: Q166: A tax imposed on the sellers of Q168: A tax on the sellers of cell Q169: Suppose the demand curve for motorcycles slopes Q170: Suppose there is currently a tax of Q330: When a tax is placed on the Q361: Which of the following statements is correct Q428: The Federal Insurance Contribution Act (FICA)tax is
![]()
Figure 6-11. On the graph below, the
Unlock this Answer For Free Now!
View this answer and more for free by performing one of the following actions

Scan the QR code to install the App and get 2 free unlocks

Unlock quizzes for free by uploading documents