Figure 6-11. On the graph below, the shift of the supply curve from S₁ to S₂ represents the imposition of a tax on a good. On the axes, Q represents the quantity of the good and P represents the price.
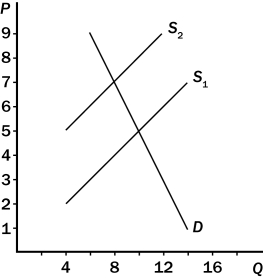
-Consider Figure 6-11.Which of the following statements correctly characterizes the burden of the tax?
A) One-fourth of the burden falls on buyers and three-fourths of the burden falls on sellers.
B) One-third of the burden falls on buyers and two-thirds of the burden falls on sellers.
C) One-half of the burden falls on buyers and one-half of the burden falls on sellers.
D) Two-thirds of the burden falls on buyers and one-third of the burden falls on sellers.
Correct Answer:
Verified
Q172: Although lawmakers legislated a fifty-fifty division in
Q173: Congress intended that
A)the entire FICA tax be
Q174: Revenue from the Federal Insurance Contribution Act
Q175: A tax on the sellers of jewelry
Q178: A $2.00 tax placed on the sellers
Q179: A tax on the sellers of TVs
A)leads
Q180: A tax of $0.10 per Snickers bar
Q181: Most labor economists believe that the supply
Q182: Figure 6-14. Q313: A payroll tax is a
![]()
A)fixed number of
Unlock this Answer For Free Now!
View this answer and more for free by performing one of the following actions

Scan the QR code to install the App and get 2 free unlocks

Unlock quizzes for free by uploading documents