Multiple Choice
Figure 7-2
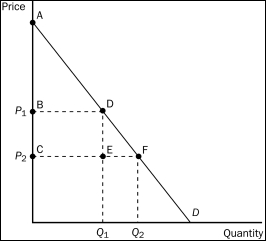
-Refer to Figure 7-2.Which area represents the increase in consumer surplus when the price falls from P₁ to P₂?
A) ABD
B) ACF
C) DEF
D) BCFD
Correct Answer:
Verified
Related Questions
Q60: Figure 7-2 Q61: If the price of oak lumber increases,what Q61: Which of the following is not true Q62: Figure 7-2 Q62: Figure 7-2 Q63: Figure 7-1 Q64: Figure 7-1 Q65: What happens to consumer surplus if the Q67: Other things equal,if the price of a Q70: Figure 7-1 Unlock this Answer For Free Now! View this answer and more for free by performing one of the following actions Scan the QR code to install the App and get 2 free unlocks Unlock quizzes for free by uploading documents
![]()
![]()
![]()
![]()
![]()
![]()

