Figure 7-4
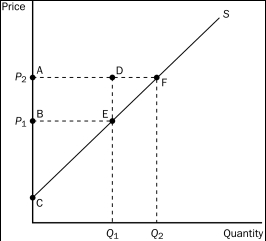
-Refer to Figure 7-4.Which area represents the increase in producer surplus when the price rises from P₁ to P₂ due to new producers entering the market?
A) BCE
B) ACF
C) DEF
D) AFEB
Correct Answer:
Verified
Q55: Dallas buys strawberries, and he would be
Q80: Figure 7-1 Q82: Producer surplus measures Q83: Figure 7-5. On the graph below, Q Q84: A seller is willing to sell a Q169: A supply curve can be used to Q174: Ally mows lawns for a living.Ally's out-of-pocket Q175: Cost is a measure of the Q250: If the demand for a good or Q300: Suppose the demand for nachos increases. What
![]()
A)the benefits to sellers of
A)seller's willingness
Unlock this Answer For Free Now!
View this answer and more for free by performing one of the following actions

Scan the QR code to install the App and get 2 free unlocks

Unlock quizzes for free by uploading documents