Multiple Choice
Figure 7-5. On the graph below, Q represents the quantity of the good and P represents the good's price.
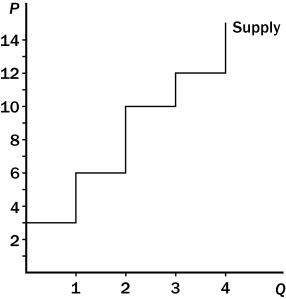
-Refer to Figure 7-5.If the price of the good is $14,then producer surplus is
A) $17.
B) $22.
C) $25.
D) $28.
Correct Answer:
Verified
Related Questions
Q9: Producer surplus is
A)measured using the demand curve
Q92: Figure 7-4 Q95: Figure 7-4 Q96: A seller's willingness to sell is Q97: Sally sharpens knives in her spare time
![]()
![]()
A)measured by

