Figure 7-6
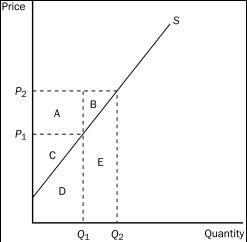
-Refer to Figure 7-6.Area B represents
A) the combined profits of all producers when the price is P₂.
B) the increase in producer surplus to all producers as the result of an increase in the price from P₁ to P₂.
C) producer surplus to new producers entering the market as the result of an increase in the price from P₁ to P₂.
D) that portion of the increase in producer surplus that is offset by a loss in consumer surplus when the price increases from P₁ to P₂.
Correct Answer:
Verified
Q61: Producer surplus is
A)represented on a graph by
Q69: Producer surplus is the
A)area under the supply
Q86: Which of the following statements is not
Q115: Figure 7-6 Q116: The following table represents the costs of Q117: The following table represents the costs of
![]()
Unlock this Answer For Free Now!
View this answer and more for free by performing one of the following actions

Scan the QR code to install the App and get 2 free unlocks

Unlock quizzes for free by uploading documents