Figure 7-6
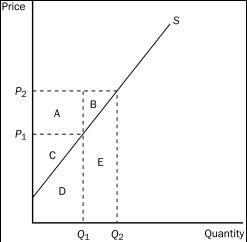
-Refer to Figure 7-6.Area A represents
A) producer surplus to new producers entering the market as the result of an increase in price from P₁ to P₂.
B) the increase in consumer surplus that results from an upward-sloping supply curve.
C) the increase in total surplus when sellers are willing and able to increase supply from Q₁ to Q₂.
D) the increase in producer surplus to those producers already in the market when the price increases from P₁ to P₂.
Correct Answer:
Verified
Q19: Donald produces nails at a cost of
Q129: Kristi and Rebecca sell lemonade on the
Q132: Market Supply and Demand for Pepperoni Pizza
Table
Q133: Market Supply and Demand for Pepperoni Pizza
Table
Unlock this Answer For Free Now!
View this answer and more for free by performing one of the following actions

Scan the QR code to install the App and get 2 free unlocks

Unlock quizzes for free by uploading documents