Figure 8-6
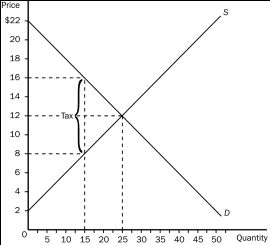
-Refer to Figure 8-6.The deadweight loss associated with this tax amounts to
A) $60, and this figure represents the amount by which tax revenue to the government exceeds the combined loss of producer and consumer surpluses.
B) $60, and this figure represents the surplus that is lost because the tax discourages mutually advantageous trades between buyers and sellers.
C) $40, and this figure represents the amount by which tax revenue to the government exceeds the combined loss of producer and consumer surpluses.
D) $40, and this figure represents the surplus that is lost because the tax discourages mutually advantageous trades between buyers and sellers.
Correct Answer:
Verified
Q123: Figure 8-7 The graph below represents a
Q124: Figure 8-6 Q125: Figure 8-5 Q126: Figure 8-6 Q127: Figure 8-7 The graph below represents a Q129: Figure 8-7 The graph below represents a Q130: Figure 8-6 Q131: Figure 8-7 The graph below represents a Q132: Figure 8-6 Q133: Figure 8-7 The graph below represents a Unlock this Answer For Free Now! View this answer and more for free by performing one of the following actions Scan the QR code to install the App and get 2 free unlocks Unlock quizzes for free by uploading documents
![]()
![]()
![]()
![]()
![]()

