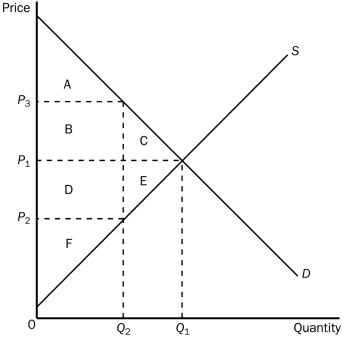
Use the following graph shown to fill in the table that follows.

Correct Answer:
Verified
Q25: The demand for bread is less elastic
Q28: The more inelastic are demand and supply,
Q41: When the government imposes taxes on buyers
Q42: As the size of a tax increases,
Q54: Economist Arthur Laffer made the argument that
Q101: Using demand and supply diagrams, show the
Q114: Illustrate on three demand-and-supply graphs how the
Q118: John has been in the habit of
Q204: If the size of a tax doubles,the
Q457: Suppose that instead of a supply-demand diagram,
Unlock this Answer For Free Now!
View this answer and more for free by performing one of the following actions

Scan the QR code to install the App and get 2 free unlocks

Unlock quizzes for free by uploading documents