Figure 9-7. On the diagram below, Q represents the quantity of cars and P represents the price of cars.
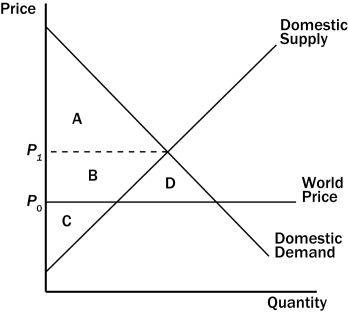
-Refer to Figure 9-7.The price corresponding to the horizontal dotted line on the graph represents the price of cars
A) after trade is allowed.
B) before trade is allowed.
C) that maximizes total surplus when trade is allowed.
D) that minimizes the well-being of domestic car producers when trade is allowed.
Correct Answer:
Verified
Q103: Figure 9-8 Q104: Figure 9-6. The figure applies to the Q105: Figure 9-8 Q106: Figure 9-7. On the diagram below, Q Q107: Figure 9-7. On the diagram below, Q Q109: Figure 9-9. The figure applies to the Q110: Figure 9-8 Q111: Figure 9-9. The figure applies to the Q112: Figure 9-6. The figure applies to the Q113: Figure 9-8 Unlock this Answer For Free Now! View this answer and more for free by performing one of the following actions Scan the QR code to install the App and get 2 free unlocks Unlock quizzes for free by uploading documents
![]()
![]()
![]()
![]()

