Figure 9-13. On the diagram below, Q represents the quantity of computers and P represents the price of computers.
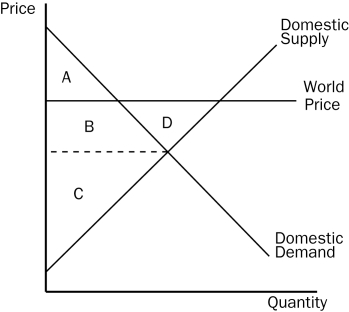
-Refer to Figure 9-13.When the country for which the figure is drawn allows international trade in computers,
A) consumer surplus changes from the area A + B + D to the area a.
B) producer surplus changes from the area C to the area B + C + D.
C) total surplus decreases by the area D.
D) All of the above are correct.
Correct Answer:
Verified
Q140: Figure 9-11 Q141: Suppose Mexico imposes a tariff on lumber.For Q143: Figure 9-12 Q144: Denmark is an importer of computer chips,taking Q145: Denmark is an importer of computer chips,taking Q148: Figure 9-13. On the diagram below, Q Q149: Turkey is an importer of goose-down pillows.The Q150: Figure 9-13. On the diagram below, Q Q152: A tariff on a product makes Q160: A tariff
![]()
![]()
A)domestic sellers
A)lowers the domestic price of the
Unlock this Answer For Free Now!
View this answer and more for free by performing one of the following actions

Scan the QR code to install the App and get 2 free unlocks

Unlock quizzes for free by uploading documents