Figure 13-2
The figure below depicts a total cost function for a firm that produces cookies.
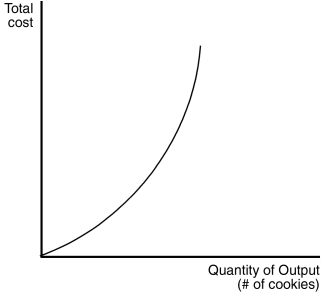
-Refer to Figure 13-2.The changing slope of the total cost curve reflects
A) decreasing average variable cost.
B) decreasing average total cost.
C) decreasing marginal product.
D) increasing fixed cost.
Correct Answer:
Verified
Q48: Figure 13-1
The figure below depicts a production
Q50: Which of the following is an implicit
Q52: Suppose that for a particular business there
Q55: John has decided to start his own
Q56: Economists assume that the goal of the
Q128: Kevin quit his $65,000 a year corporate
Q155: Which of the following statements about a
Q173: The marginal product of labor can be
Q398: The marginal product of labor is equal
Q496: The value of a business owner's time
Unlock this Answer For Free Now!
View this answer and more for free by performing one of the following actions

Scan the QR code to install the App and get 2 free unlocks

Unlock quizzes for free by uploading documents