Figure 13-3
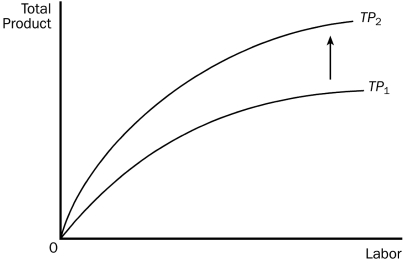
-Refer to Figure 13-3.In this diagram,the shift in the total product curve represents an increase in the firm's
A) costs of production.
B) productivity.
C) diseconomies.
D) market share.
Correct Answer:
Verified
Q84: One assumption that distinguishes short-run cost analysis
Q94: Variable cost divided by change in quantity
Q95: Table 13-3 Q97: Marginal cost equals (i) change in total cost Q100: Suppose Jan started up a small lemonade Q162: As Al's Radiator Company adds workers while Q173: Fixed costs can be defined as costs Q200: The cost of producing the typical unit Q225: The average fixed cost curve Q299: The cost of producing an additional unit
![]()
A)always declines with
Unlock this Answer For Free Now!
View this answer and more for free by performing one of the following actions

Scan the QR code to install the App and get 2 free unlocks

Unlock quizzes for free by uploading documents