Figure 13-3
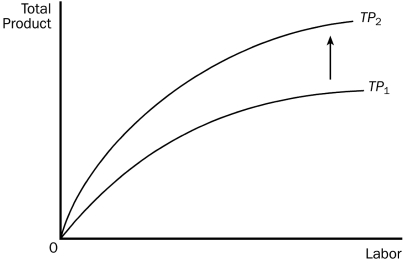
-Refer to Figure 13-3.Which of the following could explain why the total product curve shifted in this diagram?
A) A reduction in capital equipment available to the firm.
B) Labor skills have become rusty and outdated in the firm.
C) The firm has developed new technology in its production facility.
D) The firm is now receiving a higher price for its product.
Correct Answer:
Verified
Q78: When the marginal product of an input
Q87: Table 13-3 Q88: Table 13-3 Q131: Let L represent the number of workers Q162: Which of the following costs do not Q177: If a firm produces nothing, which of Q186: Average total cost equals Q204: Variable cost divided by quantity produced is Q298: The amount by which total cost rises Q366: Which of these assumptions is often realistic
![]()
![]()
A)change in total costs
A)average
Unlock this Answer For Free Now!
View this answer and more for free by performing one of the following actions

Scan the QR code to install the App and get 2 free unlocks

Unlock quizzes for free by uploading documents