Figure 13-7
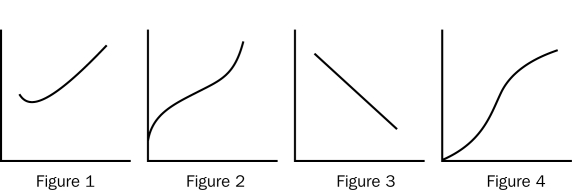
-Refer to Figure 13-7.Which of the figures represents the marginal cost curve for a firm?
A) Figure 1
B) Figure 2
C) Figure 3
D) Figure 4
Correct Answer:
Verified
Q141: Table 13-5 Q142: Figure 13-7 Q143: Table 13-5 Q145: Scenario 13-5 Q147: Scenario 13-5 Q148: Scenario 13-5 Q149: Whenever marginal cost is greater than average Q181: Average total cost (ATC) is calculated as Q350: If marginal cost is below average total Q363: The firm's efficient scale is the quantity Unlock this Answer For Free Now! View this answer and more for free by performing one of the following actions Scan the QR code to install the App and get 2 free unlocks Unlock quizzes for free by uploading documents
![]()
![]()
![]()
A certain firm produces and sells
A certain firm produces and sells
A certain firm produces and sells

