Multiple Choice
Figure 13-8
The figure below depicts average total cost functions for a firm that produces automobiles.
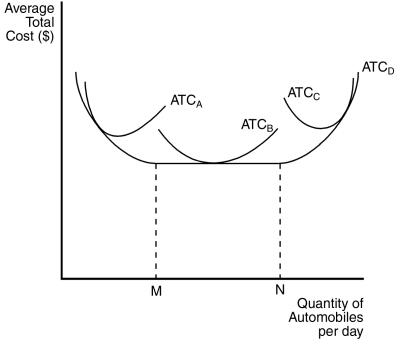
-Refer to Figure 13-8.Which curve represents the long-run average total cost?
A) ATCA
B) ATCB
C) ATCC
D) ATCD
Correct Answer:
Verified
Related Questions
Q134: The minimum points of the average variable
Q205: Figure 13-8
The figure below depicts average total
Q206: Given the cost curves shown in the

