Multiple Choice
Figure 13-9
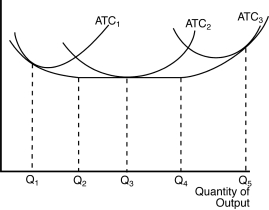
-Refer to Figure 13-9.The three average total cost curves on the diagram correspond to three different
A) time horizons.
B) products.
C) firms.
D) factory sizes.
Correct Answer:
Verified
Related Questions
Q82: In setting the production level, a firm's
Q97: How long does it take a firm
Q98: When comparing short-run average total cost with
Q109: Economies of scale arise when
A)an economy is
Unlock this Answer For Free Now!
View this answer and more for free by performing one of the following actions

Scan the QR code to install the App and get 2 free unlocks

Unlock quizzes for free by uploading documents