Figure 14-1
The graph below depicts the cost structure for a firm in a competitive market.
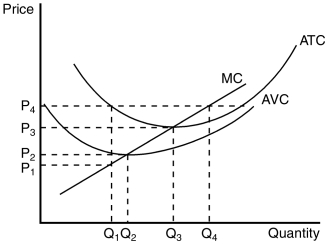
-Refer to Figure 14-1.When price falls from P₃ to P₁,the firm finds that
A) fixed cost is higher at a production level of Q₁ than it is at Q₃.
B) it should produce Q₁ units of output.
C) it should produce Q₃ units of output.
D) it should shut down immediately.
Correct Answer:
Verified
Q74: When calculating marginal cost,what must the firm
Q76: Figure 14-3
The figure below depicts the cost
Q77: Figure 14-1
The graph below depicts the cost
Q81: Figure 14-5
The figure below depicts the cost
Q83: When a restaurant stays open for lunch
Q84: A profit-maximizing firm will shut down in
Q199: The short-run supply curve for a firm
Q386: When total revenue is less than variable
Q399: Which of the following statements best reflects
Q402: When a profit-maximizing firm's fixed costs are
Unlock this Answer For Free Now!
View this answer and more for free by performing one of the following actions

Scan the QR code to install the App and get 2 free unlocks

Unlock quizzes for free by uploading documents