Figure 14-1
The graph below depicts the cost structure for a firm in a competitive market.
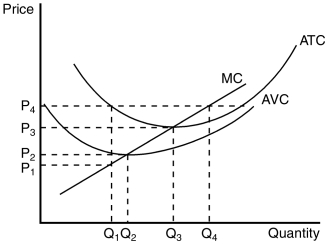
-Refer to Figure 14-1.When price rises from P₃ to P₄,the firm finds that
A) fixed costs are lower at a production level of Q₄.
B) it can earn a positive profit by increasing production to Q₄.
C) profit is still maximized at a production level of Q₃.
D) average revenue exceeds marginal revenue at a production level of Q₄.
Correct Answer:
Verified
Q60: If marginal cost exceeds marginal revenue,the firm
A)is
Q62: Figure 14-3
The figure below depicts the cost
Q63: Shrimp Galore,a shrimp harvesting business in the
Q65: Suppose a profit-maximizing firm in a competitive
Q69: Figure 14-2
The figure below depicts the cost
Q161: When marginal revenue equals marginal cost, the
Q190: When price is greater than marginal cost
Q226: When fixed costs are ignored because they
Q273: A profit-maximizing firm in a competitive market
Q388: When a perfectly competitive firm decides to
Unlock this Answer For Free Now!
View this answer and more for free by performing one of the following actions

Scan the QR code to install the App and get 2 free unlocks

Unlock quizzes for free by uploading documents