Figure 14-4
The figure below depicts the cost structure of a firm in a competitive market.
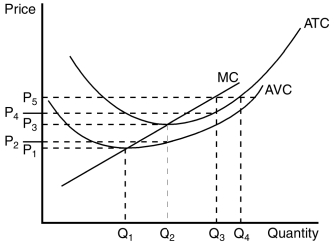
-Refer to Figure 14-4.When market price is P₅,a profit-maximizing firm's profits can be represented by the area
A) P₅  Q₃.
Q₃.
B) (P₅ - P₃)  Q₂.
Q₂.
C) (P₅ - P₄)  Q₃.
Q₃.
D) When market price is P₅ there are no profits.
Correct Answer:
Verified
Q87: Figure 14-4
The figure below depicts the cost
Q90: In the long run,all of a firm's
Q93: Figure 14-5
The figure below depicts the cost
Q95: A competitive firm's short-run supply curve is
Q96: Figure 14-4
The figure below depicts the cost
Q164: When profit-maximizing firms in competitive markets are
Q183: If a profit-maximizing firm in a competitive
Q185: Profit-maximizing firms enter a competitive market when,
Q268: For any given price, a firm in
Q313: When a profit-maximizing firm is earning profits,
Unlock this Answer For Free Now!
View this answer and more for free by performing one of the following actions

Scan the QR code to install the App and get 2 free unlocks

Unlock quizzes for free by uploading documents