Figure 14-5
The figure below depicts the cost structure of a firm in a competitive market.
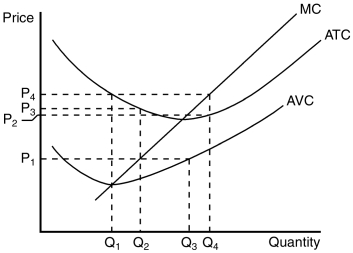
-Refer to Figure 14-5.When market price is P₁,a profit-maximizing firm's total revenue can be represented by the area
A) P₁ × Q₂.
B) P₂ × Q₂.
C) P₃ × Q₂.
D) P₁ × Q₃.
Correct Answer:
Verified
Q76: Figure 14-3
The figure below depicts the cost
Q77: Figure 14-1
The graph below depicts the cost
Q79: Figure 14-1
The graph below depicts the cost
Q83: When a restaurant stays open for lunch
Q84: A profit-maximizing firm will shut down in
Q268: For any given price, a firm in
Q386: When total revenue is less than variable
Q399: Which of the following statements best reflects
Q402: When a profit-maximizing firm's fixed costs are
Q430: In the long run, a profit-maximizing firm
Unlock this Answer For Free Now!
View this answer and more for free by performing one of the following actions

Scan the QR code to install the App and get 2 free unlocks

Unlock quizzes for free by uploading documents