Figure 14-5
The figure below depicts the cost structure of a firm in a competitive market.
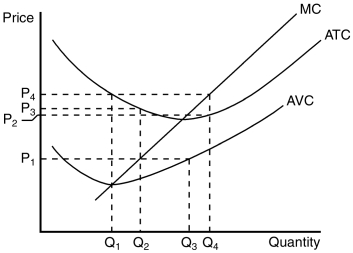
-Refer to Figure 14-5.When market price is P₁,a profit-maximizing firm's total profit or loss can be represented by which area?
A) P₁ × Q₃; profit
B) (P₃ - P₁) × Q₂ ; loss
C) (P₂ - P₁) × Q₁; loss
D) We can't tell because we don't know fixed costs.
Correct Answer:
Verified
Q95: A competitive firm's short-run supply curve is
Q96: Figure 14-4
The figure below depicts the cost
Q98: By comparing marginal revenue and marginal cost,a
Q99: One of the most important determinants of
Q101: Scenario 14-2
Assume a certain firm is producing
Q103: A competitive firm's marginal cost curve is
Q105: Scenario 14-2
Assume a certain firm is producing
Q122: A competitive firm has been selling its
Q183: At the profit-maximizing level of output,
A)marginal revenue
Q321: When a profit-maximizing competitive firm finds itself
Unlock this Answer For Free Now!
View this answer and more for free by performing one of the following actions

Scan the QR code to install the App and get 2 free unlocks

Unlock quizzes for free by uploading documents