Multiple Choice
Figure 15-2
The figure below illustrates the cost and revenue structure for a monopoly firm.
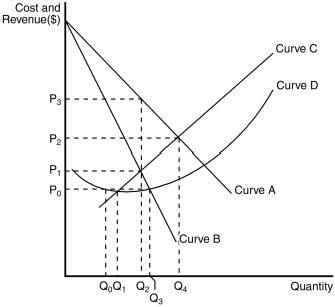
-Refer to Figure 15-2.The demand curve for a monopoly firm is depicted by curve
A) a.
B) B.
C) C.
D) D.
Correct Answer:
Verified
Related Questions

