Figure 15-2
The figure below illustrates the cost and revenue structure for a monopoly firm.
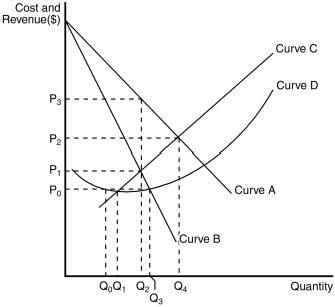
-Refer to Figure 15-2.The average total cost curve for a monopoly firm is depicted by curve
A) a.
B) B.
C) C.
D) D.
Correct Answer:
Verified
Q63: Figure 15-2
The figure below illustrates the cost
Q66: Which of the following statements is true?
Q72: Figure 15-2
The figure below illustrates the cost
Q82: Monopoly firms have
A) downward-sloping demand curves, and
Q296: When a monopolist decreases the price of
Q310: Because many good substitutes exist for a
Q311: Competitive firms have
A)downward-sloping demand curves, and they
Q321: Marginal revenue for a monopolist is computed
Q326: Marginal revenue can become negative for
A)both competitive
Q389: Table 15-1 ![]()
Unlock this Answer For Free Now!
View this answer and more for free by performing one of the following actions

Scan the QR code to install the App and get 2 free unlocks

Unlock quizzes for free by uploading documents