Figure 15-4
The figure below depicts the demand and marginal cost curves of a profit-maximizing monopolist.
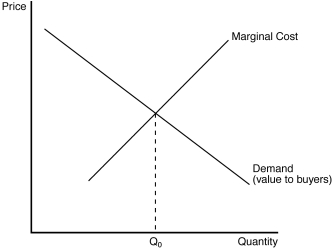
-Refer to Figure 15-4.If the monopoly operates at an output level below Q₀,then an increase in output toward Q₀ (but not so large an increase as to exceed Q₀) would
A) raise the price and raise total surplus.
B) lower the price and raise total surplus.
C) raise the price and lower total surplus.
D) lower the price and lower total surplus.
Correct Answer:
Verified
Q109: When regulators use a marginal-cost pricing strategy
Q172: Economic welfare is generally measured by (i) profit.
(ii) total
Q174: Selling a good at a price determined
Q177: A monopoly chooses to supply the market
Q178: Figure 15-6 Q179: Figure 15-5 Q180: Figure 15-6 Q244: The difference in total surplus between the Q253: For a monopoly market, total surplus can Q308: Table 15-5 Unlock this Answer For Free Now! View this answer and more for free by performing one of the following actions Scan the QR code to install the App and get 2 free unlocks Unlock quizzes for free by uploading documents
![]()
The figure below depicts the demand,
![]()
![]()

