Figure 15-5
The figure below depicts the demand, marginal revenue and marginal cost curves of a profit-maximizing monopolist.
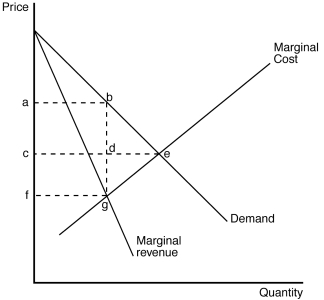
-Refer to Figure 15-5.Which area represents the total surplus lost due to monopoly pricing?
A) Triangle bde.
B) Triangle bge.
C) Rectangle acdb.
D) Rectangle cfgd.
Correct Answer:
Verified
Q164: The amount that producers receive for a
Q165: Figure 15-6 Q169: Figure 15-4 Q170: Figure 15-6 Q172: Economic welfare is generally measured by (i) profit. Q236: Which of the following statements is correct? Q243: If a social planner were running a Q253: For a monopoly market, total surplus can Q255: When the government creates a monopoly, the Q308: Table 15-5 Unlock this Answer For Free Now! View this answer and more for free by performing one of the following actions Scan the QR code to install the App and get 2 free unlocks Unlock quizzes for free by uploading documents
![]()
The figure below depicts the demand
![]()
(ii) total
A)The
![]()

