Figure 17-3
The lines in the figures below illustrate the potential effect of entry and exit in a monopolistically competitive market on either the demand curve or the marginal cost curve of existing firms.
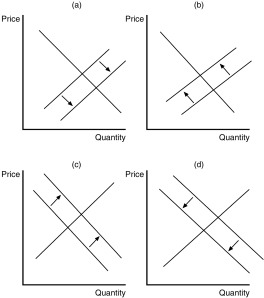
-Refer to Figure 17-3.Which of the diagrams illustrates the impact of some existing firms leaving the market?
A) Panel a
B) Panel b
C) Panel c
D) Panel d
Correct Answer:
Verified
Q30: If firms in a monopolistically competitive market
Q32: Figure 17-4 Q37: If firms in a monopolistically competitive market Q217: A monopolistically competitive firm chooses Q363: As new firms enter a monopolistically competitive Q365: When a profit-maximizing firm in a monopolistically Q366: When a profit-maximizing firm in a monopolistically Q367: As firms exit a monopolistically competitive market, Q369: A profit-maximizing firm operating in a monopolistically Q380: In monopolistically competitive markets, economic losses
![]()
A)the quantity of
A)suggest that
Unlock this Answer For Free Now!
View this answer and more for free by performing one of the following actions

Scan the QR code to install the App and get 2 free unlocks

Unlock quizzes for free by uploading documents