The figure represents the value of marginal product for a firm that sells its product in a competitive market.
Figure 18-1
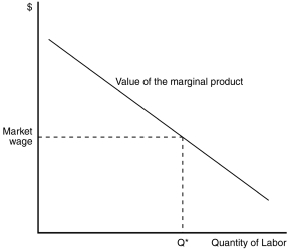
-Refer to Figure 18-1.The value of the marginal product curve shown in this figure is the same as which of the following?
A) the labor supply curve
B) the labor demand curve
C) the marginal revenue curve
D) the total revenue curve
Correct Answer:
Verified
Q66: Suppose that in January a profit-maximizing firm
Q101: If the wage exceeds the value of
Q103: Typically,as a firm hires additional workers,the marginal
Q107: For the profit-maximizing competitive firm,the value of
Unlock this Answer For Free Now!
View this answer and more for free by performing one of the following actions

Scan the QR code to install the App and get 2 free unlocks

Unlock quizzes for free by uploading documents