Figure 18-3
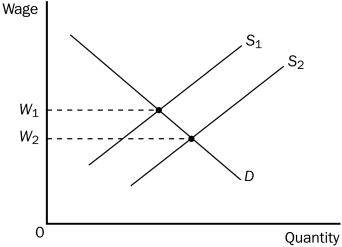
-Refer to Figure 18-3.The shift of the labor supply curve from S₁ to S₂ could possibly be explained by
A) a change in workers' attitudes toward the work-leisure tradeoff.
B) decreases in wages in other labor markets.
C) immigration of workers into the region or country.
D) All of the above are correct.
Correct Answer:
Verified
Q119: Figure 18-2 Q162: When workers are in an industry that Q163: Scenario 18-3 Q165: Scenario 18-3 Q166: Scenario 18-3 Q168: Scenario 18-4 Q169: Figure 18-3 Q170: Consider the market for university economics professors.Consider Q171: Figure 18-2 Q172: Figure 18-2 Unlock this Answer For Free Now! View this answer and more for free by performing one of the following actions Scan the QR code to install the App and get 2 free unlocks Unlock quizzes for free by uploading documents
![]()
In 1997, Albania experienced a civil
In 1997, Albania experienced a civil
In 1997, Albania experienced a civil
Rocchetta Industries manufactures and supplies bottled
![]()
![]()
![]()

