Figure 20-2
Poverty Rates by Age 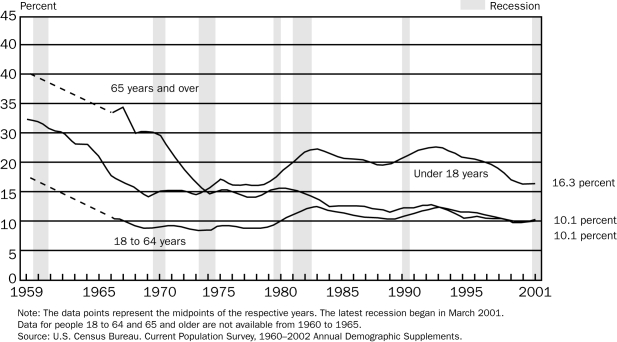
-Refer to Figure 20-2.From 1969 to 2001,the percent of elderly aged 64 and over in poverty has
A) declined,while the percentage of children under age 18 in poverty has also declined.
B) declined,while the percentage of children under age 18 in poverty has increased.
C) increased,while the percentage of children under age 18 in poverty has declined.
D) increased,while the percentage of children under age 18 in poverty has also increased.
Correct Answer:
Verified
Q141: Figure 20-2
Poverty Rates by Age 
Q142: Table 20-4
Poverty Thresholds in 2002,by Size of
Q144: Figure 20-2
Poverty Rates by Age
Q146: Figure 20-2
Poverty Rates by Age
Q147: Figure 20-2
Poverty Rates by Age
Q148: Which of the following groups has the
Q302: The calculation of the poverty line includes
Q303: The income level below which families are
Q304: The poverty line is adjusted each year
Q332: In comparison to the average poverty rate,
A)children
Unlock this Answer For Free Now!
View this answer and more for free by performing one of the following actions

Scan the QR code to install the App and get 2 free unlocks

Unlock quizzes for free by uploading documents