Figure 21-5
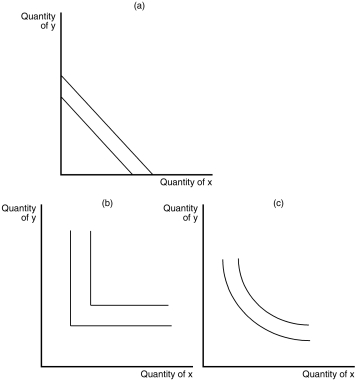
-Refer to Figure 21-5.Which of the graphs shown may represent indifference curves?
A) graph (a)
B) graph (b)
C) graph (c)
D) All of the above are correct.
Correct Answer:
Verified
Q58: A consumer's preferences for right shoes and
Q60: The rate at which a consumer is
Q60: Which of the following is a property
Q62: When indifference curves are bowed in toward
Q66: A consumer has preferences over two goods:
Q150: All of the following are properties of
Q281: Indifference curves graphically represent
A)an income level sufficient
Q289: If two bundles of goods give a
Q359: A set of indifference curves that are
Q379: When two goods are perfect substitutes, the
Unlock this Answer For Free Now!
View this answer and more for free by performing one of the following actions

Scan the QR code to install the App and get 2 free unlocks

Unlock quizzes for free by uploading documents