Figure 26-2
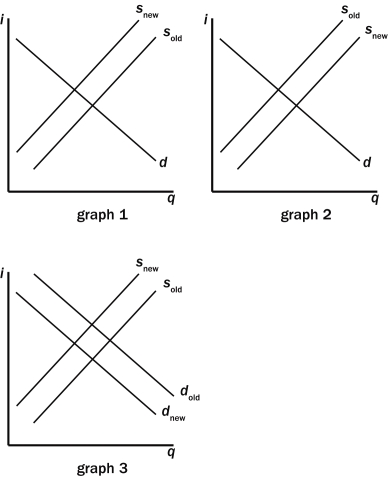
-Refer to Figure 26-2.Which of the graphs in the figure above shows the effects of the government moving from a budget deficit to a budget surplus while also lowering tax rates on interest earnings?
A) graph 1
B) graph 2
C) graph 3
D) None of the above is correct.
Correct Answer:
Verified
Q9: Most entrepreneurs finance their purchases of real
Q23: Public saving is T - G, while
Q29: National saving is equal to Y -
Q180: Other things the same, the higher the
Q180: Generally, if people expect a company to
Q240: Suppose that government expenditures on goods and
Q243: If people become less optimistic about the
Q246: If you know that Colorado Dreams Corporation,a
Q247: Which of the following is not correct?
A)If
Q353: In recent years the U.S.national debt has
Unlock this Answer For Free Now!
View this answer and more for free by performing one of the following actions

Scan the QR code to install the App and get 2 free unlocks

Unlock quizzes for free by uploading documents