Use the figure below for the following questions.
Figure 30-1
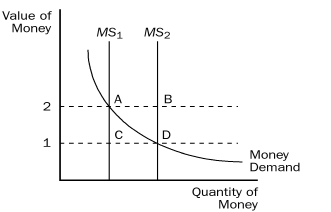
-Refer to Figure 30-1.When the money supply curve shifts from MS₁ to MS₂,
A) the equilibrium value of money decreases.
B) the equilibrium price level decreases.
C) the supply of money has decreased.
D) the demand for goods and services will decrease.
Correct Answer:
Verified
Q41: When the money market is drawn with
Q47: Open-market purchases by the Fed make the
Q49: Use the figure below for the following
Q50: Sally sells 40 bags of lettuce for
Q51: Real GDP measures
A)the total quantity of final
Q56: In the 1970s in response to recessions
Q57: A decrease in the money supply creates
Q76: When the money market is drawn with
Q78: When the money market is drawn with
Q82: Economic variables whose values are measured in
Unlock this Answer For Free Now!
View this answer and more for free by performing one of the following actions

Scan the QR code to install the App and get 2 free unlocks

Unlock quizzes for free by uploading documents