Suppose a plot of sales data over time appears to follow an S-shape as illustrated on the next page. 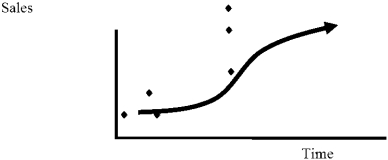 Which of the following is likely that the best forecasting functional form to use for sales data above?
A) A linear trend, Sales = a + bT
B) A quadratic shape in T, using T-squared as another variable, Sales = a + bT + cT2.
C) A semi-log form as sales appear to be growing at a constant percentage rate, Ln Sales = a + bT
D) A cubic shape in T, using T-squared and T-cubed as variables, Sales = a + bT + cT2 + dT3.
E) A quadratic shape in T and T-squared as variables, Sales = a + bT + cT2
Correct Answer:
Verified

Unlock this Answer For Free Now!
View this answer and more for free by performing one of the following actions

Scan the QR code to install the App and get 2 free unlocks

Unlock quizzes for free by uploading documents