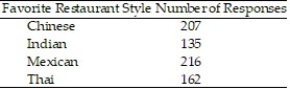
Construct a pie graph, with sectors given in percent, to represent the data in the given table:
-

A) 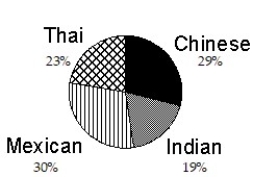
B) 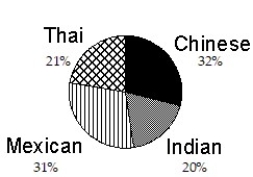
C) 
D) 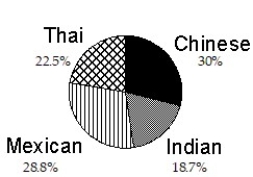
Correct Answer:
Verified
Q9: Construct a bar graph of the given
Q10: Construct a bar graph of the given
Q11: Construct a broken-line graph of the data
Q12: Construct a broken-line graph of the data
Q13: Construct a pie graph, with sectors given
Q15: Construct a pie graph, with sectors given
Q16: Construct a frequency polygon: Q17: Construct a frequency polygon: Q18: Find the mean for the data set: Q19: Following is a sample of the percent
-![]()
-![]()
2,
Unlock this Answer For Free Now!
View this answer and more for free by performing one of the following actions

Scan the QR code to install the App and get 2 free unlocks

Unlock quizzes for free by uploading documents