Exhibit
The graph depicts a monopolistically competitive firm's demand, marginal revenue, and cost curves.
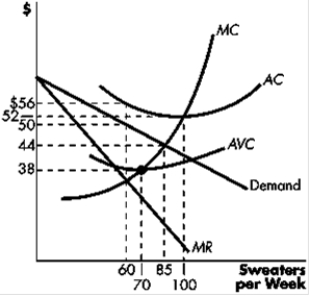
-Refer to Exhibit. If the firm produces the profit-maximizing (or loss-minimizing) level of output, it will produce:
A) 100 sweaters each week.
B) 85 sweaters each week.
C) 70 sweaters each week.
D) 60 sweaters each week.
Correct Answer:
Verified
Q2: Exhibit
The following diagram depicts monopolistically competitive firms.
Q3: Exhibit
The following diagram depicts monopolistically competitive firms.
Q4: Exhibit
The following diagram depicts monopolistically competitive firms.
Q5: Exhibit
The following diagrams depict firms in monopolistically
Q6: Exhibit
The following diagrams depict firms in monopolistically
Q8: Exhibit
The graph depicts a monopolistically competitive firm's
Q9: Exhibit
The graph depicts a monopolistically competitive firm's
Q10: A natural monopolist will voluntarily choose to
Q11: Perfectly competitive firms and monopolists are different
Q12: Based on the table below what is
Unlock this Answer For Free Now!
View this answer and more for free by performing one of the following actions

Scan the QR code to install the App and get 2 free unlocks

Unlock quizzes for free by uploading documents